A tank-level reading tells you how much water is present at one moment; it does not tell you how much entered, left or was used during a shift, day or month. By the end, you will know where to install a flow meter, which readings to retain, how to test their accuracy and how to turn them into an auditable consumption record.
Key takeaways
- Do not treat tank level changes as measured consumption.
- Install the meter where it answers a defined inflow or outflow question.
- Record meter readings with timestamps, units, and meter identifiers.
- Compare range, installation conditions, and technology before judging accuracy.
Start with the measurement: level is not consumption
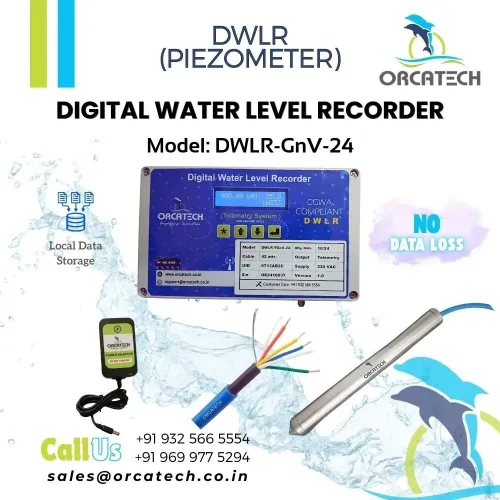
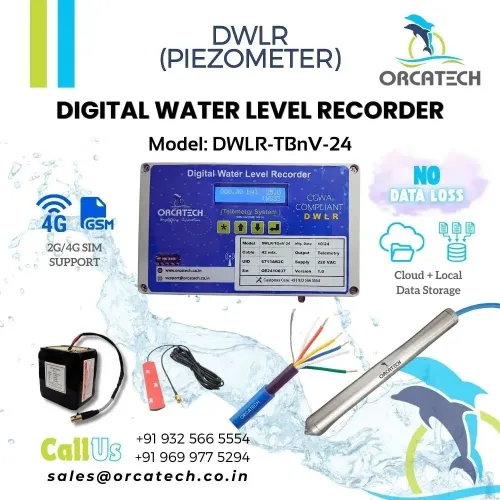
A water-level recorder tells you how high water stands; it does not tell you how much entered or left a pipe. A falling tank level could mean consumption, a leak, a transfer or evaporation. Converting level to volume also requires a calibrated tank-shape table and knowledge of inflow and outflow.
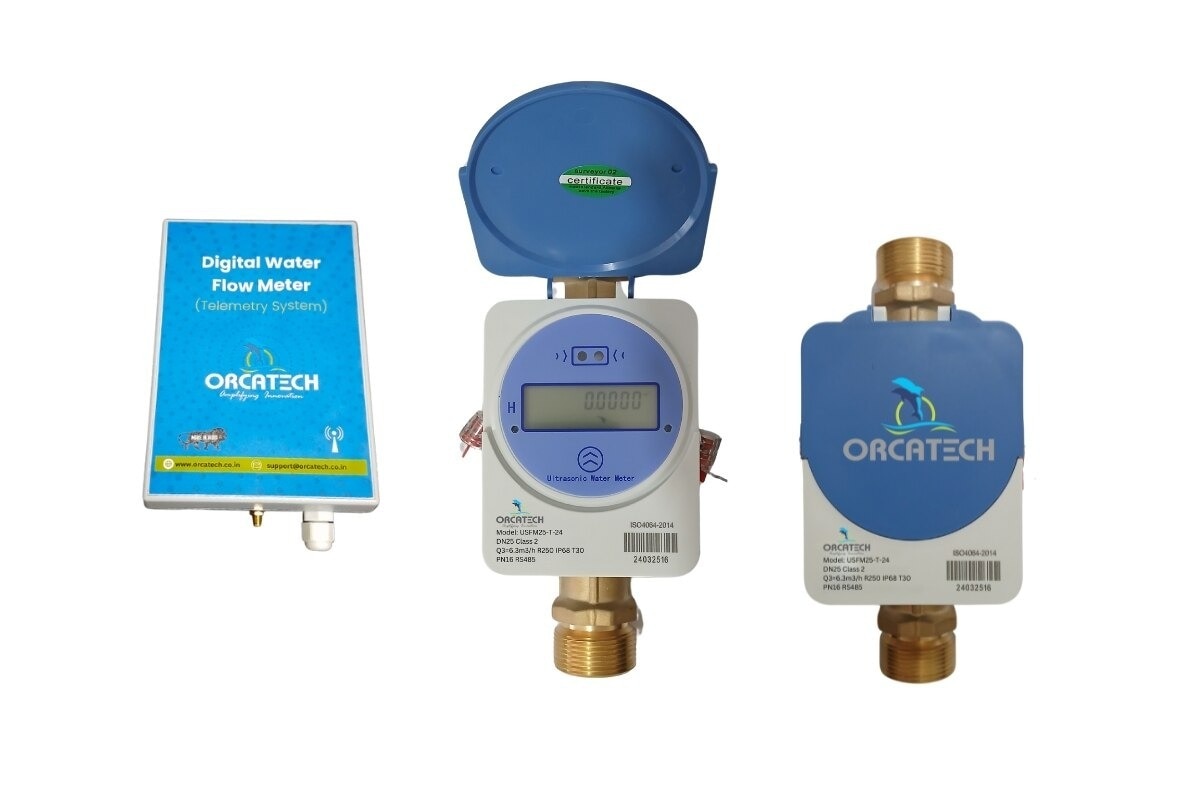
Accurate water consumption tracking needs flow measurement over time: an instantaneous flow rate plus a cumulative register in litres or cubic metres. The digital water meter should add measured forward volume at defined intervals, preserve opening and closing totals, and identify flow below its measurement threshold rather than silently treating it as zero.
The communications system is not the measurement. If telemetry fails, the meter must keep recording locally in nonvolatile memory and backfill readings after reconnection; a data gap is not zero consumption. Define how reverse flow, empty-pipe status and reverse volume appear in the record, because net totals change when backflow is subtracted or merely flagged.
Specify these points before buying:
- Unit and interval: litres or cubic metres, timestamp, rate and cumulative total
- Low-flow and empty-pipe status: threshold, flag and treatment in totals
- Flow direction: blocked, separately accumulated, subtracted or flagged
- Data continuity: local storage capacity and post-outage backfill behaviour
Choose the installation point that matches the question
Install the meter on the pipe that matches the volume you need to report; the location defines the consumption figure. An inlet meter records water entering a site or building, while an outlet meter records water leaving a storage tank or treatment stage.
Those readings differ when tank inventory changes or water is lost between points.
| Location | Figure captured | Main limitation |
|---|---|---|
| Inlet meter | Total water supplied across the site boundary | It includes storage, distribution losses and every user downstream |
| Outlet meter | Water released from a tank into the site network | It excludes water still in the tank and includes downstream losses |
| Branch-line meter | Water supplied to one building, department or utility branch | It does not represent unmetered branches or the whole site |
| Process-line meter | Water delivered to a defined production step or machine | It excludes sanitation, cooling, make-up and other site demands |
| Discharge-line meter | Water leaving the site or process as effluent | It measures discharge, not water consumed |
Use a branch-line meter when the question is “Which department used this water?” Use a process-line meter when you need a production-specific figure, such as litres per batch. Put the meter at the site inlet when you need the quantity purchased or received from the utility.
For a water balance, pair the inlet reading with relevant branch, process and discharge readings. Reconcile the difference against tank-volume change; otherwise, a total that looks like consumption may contain leakage, evaporation, unmetered use or timing differences. A level sensor alone cannot replace these flow measurements.
Convert meter readings into a traceable consumption record
Turn each timestamped meter register into a volume record, then aggregate those records against a defined billing period. The meter’s cumulative volume is the primary source; instantaneous flow in LPM is a rate, not consumption, unless you integrate it over time.
Use a fixed interval, such as 15 minutes or one hour, and calculate each interval total by subtracting the previous register value from the current value. If the device provides only instantaneous flow, multiply the flow rate by the elapsed time and convert litres to cubic metres.
Store the timestamp, unit, meter identifier, register value, interval totals and quality flag with every reading.
- Daily total: sum valid interval totals from 00:00 through 23:59, while recording any missing or estimated intervals separately.
- Monthly total: sum the daily totals for the agreed calendar month, or subtract the opening register from the closing register after checking resets and rollovers.
- Invoice-ready total: match the supplier’s meter number, reading dates, units, opening reading, closing reading and billed volume; investigate any difference before approval.
A communications outage is a delayed delivery or data gap, not zero consumption. Require local nonvolatile storage and backfill after reconnection, and label missing, estimated, substituted and manually edited values. Reconcile the result with tank-volume changes and other meters, allowing for storage and timing differences.
Judge accuracy by range, installation and meter technology
An accuracy claim is meaningful only across the meter’s operating range. ISO 4064 and OIML R 49 define Q1, Q2, Q3 and Q4: minimum, transition, permanent and overload flow rates. Compare the turndown ratio R = Q3/Q1, not just pipe size or Q3.
A meter rated “±1% full-scale accuracy” can produce a much larger percentage error at a low flow.
OIML R 49 Class 1 permits ±1% from Q2 through Q4 and ±3% from Q1 up to Q2; Class 2 permits ±2% and ±5% respectively. These are controlled-test limits, not a promise of identical field performance. Check the installation manual for straight-pipe lengths, flow conditioners, valve positions and full-pipe requirements before comparing technologies.
| Technology | Strength | Main risk | Choose it when |
|---|---|---|---|
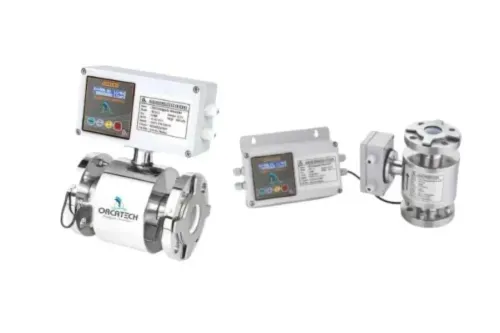
| Ultrasonic | No moving parts and low pressure loss | Entrained air, gas pockets, suspended solids, poor pipe filling or disturbed flow weaken the acoustic path | You can maintain a full, clean pipe and follow the acoustic installation requirements |
| Electromagnetic | No moving parts and strong performance on conductive water | Needs conductivity, grounding and a full pipe; non-conductive fluids will not measure correctly | The water is conductive and the line stays full |
| Mechanical | Familiar, widely serviceable and practical for many utility lines | Wear, fouling and pressure loss can change low-flow performance | You need a proven meter with accessible maintenance |
| Turbine | Good repeatability in clean, steady flow | Rotor wear, debris and disturbed flow affect readings | Water is clean and filtration and straight-run requirements are manageable |
Verify the installed meter separately from its telemetry: a live signal proves communication, not metrological accuracy. Specify calibration intervals, test methods and acceptance limits.
Make the data useful for leakage analysis and governance
A water balance is only as defensible as the records behind it. Keep the meter’s cumulative register, interval readings, timestamp, device identity and unit together so daily totals can be traced back to an actual meter value.
Control the record with these checks:
- Store readings locally in nonvolatile memory and define backfill after reconnection. Telemetry transports data; it does not measure flow. A communications outage must appear as a gap or delayed delivery, never as zero use.
- Preserve data quality flags and provenance. Mark missing, estimated, substituted, manually edited and meter-generated values separately instead of silently filling gaps.
- Build night-flow analysis around operating schedules and process-state data. Cooling make-up, sanitation, compressed-air systems and automatic cleaning can create legitimate off-shift flow, so a residential leak threshold will misclassify industrial use.
- Check low-flow coverage against ISO 4064 Q1, Q3 and the turndown ratio R = Q3/Q1. Flow below Q1 can disappear from the record, hiding a continuous leak even when the meter works correctly.
For a meter supplied by Orcatech Enterprises, ask for the Q1 value, interval-storage capacity, outage-backfill rule and audit trail before approving it; a headline full-scale accuracy figure cannot answer those questions. Reconcile site totals with invoices, tank-volume changes and known process withdrawals, then investigate unexplained differences rather than editing them away.
Related products
 | Ultrasonic Flow Meter ₹45902 Telemetry Ultrasonic Flow Meter, Line Size: 50mm (2.0"), Flow Range 100 to 1000 LPM, Battery Operated Flowmeter, Data Logger Supply 220Vac, Flange... View product → |
 | Ultrasonic Flow Meter ₹47200 Telemetry Ultrasonic Flow Meter, Line Size: 65mm (2.5"), Flow Range 150 to 1500 LPM, Battery Operated Flowmeter, Data Logger Supply 220Vac, Flange... View product → |
Frequently asked questions
Does a water-level recorder measure water consumption?
No. It measures the height of water. A level change could result from consumption, leakage, transfer, inflow, or evaporation.
Where should you install a digital water meter?
Install it on the pipe whose flow answers your question, such as the site inlet, a process branch, a tank inlet, or a discharge line.
What makes water-consumption data traceable?
Keep timestamped readings with the meter identifier, unit, cumulative total, installation point, and records of resets, maintenance, and calibration.
How do you judge a digital water meter's accuracy?
Check its measurement range, meter technology, pipe conditions, installation layout, and suitability for the expected flow rate.